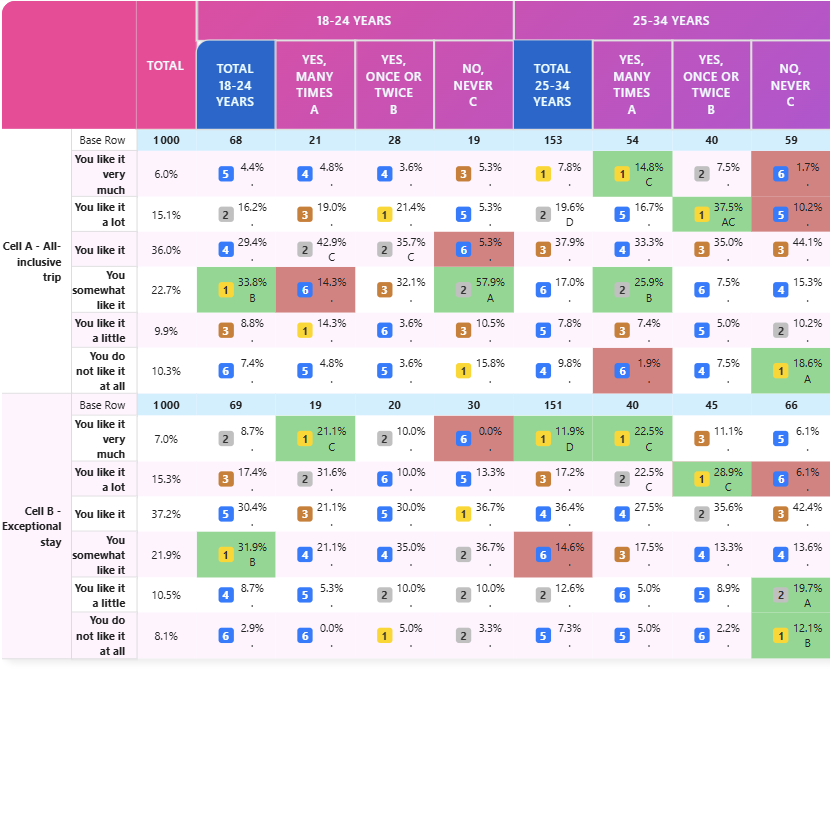
Easy to Use
Our tools make it easy to create and analyze cross-tabulation tables in Power BI — as numbers or as small in-cell charts. Show significance testing, base, apply thresholds, and customize formatting with just a few clicks.
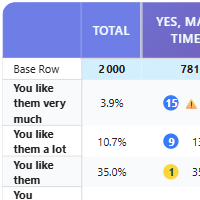
Focus on What Matters
Don't waste time wrangling data or building complex formulas. Instead, focus on interpreting results and making data-driven decisions.
Powered by Power BI
Extend your Power BI reports and dashboards with custom visuals that create cross tables with significance testing, thresholds, and more.
Two visuals, one family
Same data roles, same percentage/mean engine, same significance tests — pick the visual that fits how a table should read.
CrossTable
The full crosstab: numeric cells, Ranking badges & gradients, Cell Rules conditional decoration, Tile Mode.
Explore CrossTable →CrossTable InCell Charts
The same hierarchical table, with Data Bar and Data Line mini-charts — and Gap Mode comparison columns — instead of plain numbers.
Explore InCell Charts →