What is SDM Cross Table Tool?
Purpose & Design Philosophy
The SDM Cross Table Tool (Socio Data Management Cross Table Tool for Power BI) is a specialized Power BI custom visual component built specifically for creating and analyzing cross-tabulation tables (also known as contingency tables or crosstabs). It goes far beyond simple data grids by providing:
- Hierarchical table structures with multiple levels of rows and columns
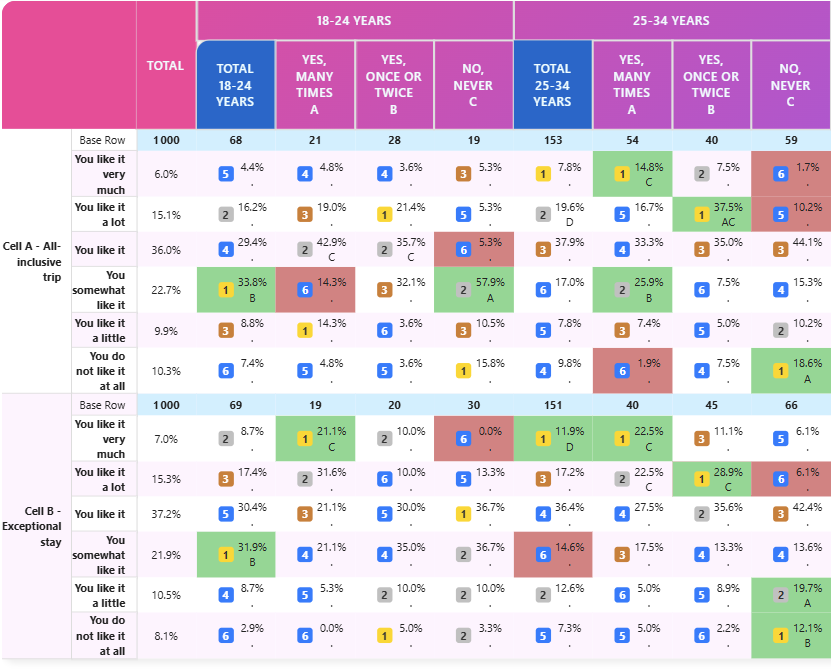
- Statistical analysis capabilities including multiple significance testing
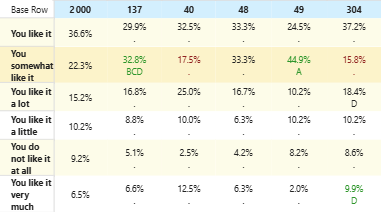
- Advanced formatting options to highlight key insights
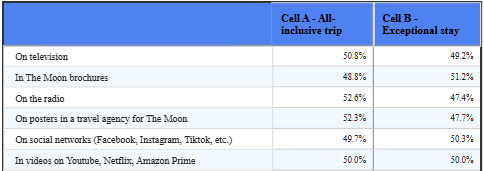
- Professional styling for reports and presentations
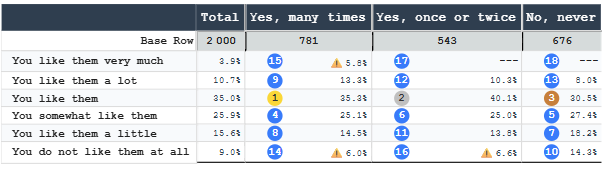
- Flexible data aggregation supporting both percentages and means
- Interactive filtering through row and column selection
Who Should Use SDM Cross Table Tool?
SDM Cross Table Tool is ideal for:
- Scientific Market Research Professionals: Analyze scientific and survey data with any breakdowns
- Data Analysts: Create multi-dimensional analysis tables with statistical rigor
- Business Intelligence Teams: Build professional dashboards and reports
- Statistical Consultants: Perform complex cross-tabulations with significance tests
- Corporate Reporting: Generate polished, formatted tables for executive presentations
Core Capabilities
1. Table Types
- Percentage Tables: Analyze response distributions and proportions
- Mean Tables: Analyze averages Power BI series with statistical measures (count, standard deviation)
2. Data Aggregation
- Support for single and multiple response modes
- Weighted and unweighted bases
- Custom series for values, bases, and significance calculations
3. Advanced Formatting
- Customize fonts, colors, and backgrounds at element level
- Apply formatting to headers, cells, and totals independently
- Dark mode support for modern dashboards
4. Statistical Analysis
- Perform significance tests between columns and segments
- Multiple test types: all columns, item vs total, regex-based
- Adjustable confidence levels (90%, 95%, 99%)
5. Smart Sorting
- Sort rows alphabetically, by column value, or custom order
- Designate "first" and "last" rows/columns to keep in place
- Sort based on specific cell properties (value, vertical %, horizontal %, indice)
6. Ranking & Visualization
- Automatically rank cells within columns
- Visual indicators: numbered badges or color gradients
- Customizable color schemes and intensity levels
7. Interactive Selection
- Users can click to select rows and columns
- Integrated Power BI cross-filtering for dynamic dashboards
- Multiple selection support for complex analysis
8. Data Protection
- Mask sensitive values below thresholds
- Apply warnings for data quality issues
- Flexible threshold rules based on cell value or base size
9. Cell Tooltip
- Native Power BI tooltip on hover, surfacing figures the table computes but doesn't necessarily display: row/column levels, value, both percentages, index, weighted and unweighted base
- The compared base and a continuous significance confidence level behind each pass/fail marker — see Cell Tooltip Reference
- Available on both CrossTable and CrossTable InCell Charts
Two visuals in this family
SDM Cross Table Tool covers CrossTable, the full crosstab described on this page. A companion visual, CrossTable InCell Charts, builds the exact same hierarchical table but renders each cell as a small Data Bar or Data Line chart instead of a plain number. Both visuals share the same data roles, percentage/mean engine, significance tests, totals, thresholds, sorting and styling — only the cell-level presentation (and a handful of table-only features like Ranking, Cell Rules and Tile Mode) differs. See the feature comparison to decide which one fits a given report.
Data Requirements
SDM Cross Table Tool requires a data source with:
- Row dimension(s): The categories for table rows
- Column dimension(s): The categories for table columns
- Measures: Numerical values to populate cells. The tool leverages the standard Power BI aggregation methods (counts, means...).
For statistical testing, you'll need additional measures for base values and significance calculations.
Typical Workflow
1. Connect your data source
2. Assign row, column, and value fields
3. Choose table type (Percentage or Mean)
4. Configure data aggregation options
5. Apply formatting and styling
6. (Optional) Configure statistical tests
7. Add sorting, ranking, or threshold rules
8. (Optional) Enable row/column selection for interactivity
9. Export or embed in reports
Next Steps
- Explore the Edition Comparison to choose the right plan
- Follow the Quick Start Guide to create your first table
- Review Use Cases for real-world examples