Sorting & Ordering Reference
Overview
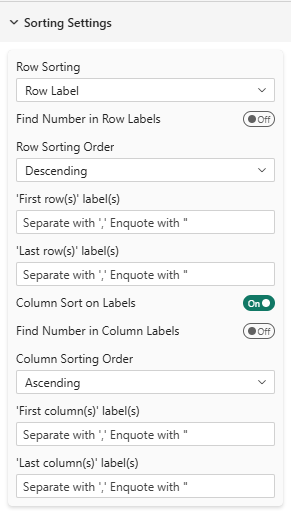
Customize how rows and columns are arranged in your table with flexible sorting options.
Row Sorting
Sort Method
Setting: Row sorting
Options: None, Row Label (Alphabetical), Column Value
Default: None
When different from 'None', rows are sorted depending on the different settings. Otherwise, rows remain in the order they come from the data source. See About sorting elements in Power BI section for more details.
None
Rows appear in the order they come from the data source.
Row Label (Alphabetical)
Sorts rows alphabetically by their label.
Example:
Before: North, South, East, West
After:  East, North, South, West
If you use this setting for numeric labels like "1", "2", "3", the '10' label will be considered as coming before "2" in alphabetical order (1,10,2,3,4...). In such cases, consider using 'Last Row/Column Positioning' to fix specific label ("10") at the end or use the new "find number in row labels" feature.

Column Value
Sorts rows based on the values found in one specific column of the table, which you designate with a column path.
Use Cases:
- Sort products by highest sales
- Rank regions by satisfaction score
- Order responses by frequency
Writing the column path
Setting: Row Sort on column (visible only when Row Sorting = Column Value)
Type: Text input
Format: One column label per hierarchy level, separated by a pipe |
The path walks the column hierarchy from left to right: the first segment is a label of the first (top) column level, the second segment a label of the second level, and so on, until it reaches the column whose values must drive the sort.
Example with two column levels — a table crossed by Gender > Age:
                    Male                      Female
             18-34       35-54         18-34       35-54
Product A     12          18            25          31
Product B     34          22            17          28
Product C     21          40            39          14
| To sort the rows on... | Enter this path |
|---|---|
| the Female / 35-54 column | Female|35-54 |
| the Male / 18-34 column | Male|18-34 |
| the Female subtotal (whole group) | Female |
| the grand Total column | (leave empty) |
With the path Female|35-54 and a Descending order, the rows of the example above are reordered on that single column: Product A (31), Product B (28), Product C (14).
Path rules
| Rule | Detail |
|---|---|
| Separator | The pipe character |. One segment per column level, top level first. |
| Case & spaces | Ignored. female | 35-54 is the same as Female|35-54. |
| Matching | The exact displayed header label, matched in full. This is not a regex and not a partial match (unlike the pattern used by Significance). |
| Quotes | Optional. "Female"|"35-54" is equivalent to Female|35-54. |
| Empty path | Sorts on the row Total column. |
| Partial path | Fewer segments than there are levels targets the subtotal of that column group (Female on a 2-level table = the Female subtotal). |
| Number of levels | Any depth is supported — a 3-level table accepts 2025|France|My Brand. |
:::tip Finding the exact paths of your table
The Regex match status read-only field of the Significance card lists all the column paths that actually exist in your table. It displays them with a > separator (Female > 35-54), so replace > with | before pasting a path into the sort field.
:::
If the path matches no column, no error is displayed: every row gets a null sort value and the rows simply stay in their original order. Check the spelling of each segment, and remember that the labels are the ones displayed in the table (after any renaming or masking).
Rows that have no value in the designated column are always pushed to the end of the table, whatever the sorting order.
The Column Property setting (Value / Horizontal Percentage / Indice) decides which number of the designated cell is used. For instance Female|35-54 combined with Horizontal Percentage sorts the rows on the horizontal percentage of that cell.
Find number in Row Labels
Setting: Find number in Row Labels
Options: True, False
Default: False
When enabled, this setting extracts numeric values from row labels for sorting purposes. This is particularly useful when your row labels contain numbers mixed with text.
Example:
| Text sorting | Find in number sorting |
|---|---|
| Brand A (2024) | Brand A (2024) |
| Brand A (2025) | Brand B (2024) |
| Brand B (2024) | Brand C (2024) |
| Brand B (2025) | Brand A (2025) |
| Brand C (2024) | Brand B (2025) |
| Brand C (2025) | Brand C (2025) |
Example with purely numeric labels:
| Text sorting | Find in number sorting |
|---|---|
| 1 | 1 |
| 10 | 2 |
| 2 | 3 |
| 3 | 4 |
| ... | ... |
| 9 | 10 |
Example with ranges in labels:
| Text sorting | Find in number sorting |
|---|---|
| none | from 1 to 50 |
| beyond 100 | from 50 to 100 |
| from 1 to 50 | beyond 100 |
| from 50 to 100 | none |
This setting is particularly useful for sorting labels that include years, ages, or other numeric indicators within text. Only the first number found in the label is considered for sorting.
If the number is prefixed with a minus sign (e.g., "-5"), it will be treated as a negative number.
Sort Direction
Sorting Order
Setting: Row sorting order
Options: Ascending, Descending
Default: Ascending
Controls whether sorted values go low-to-high or high-to-low.
Example (Column Value sorting):
- Ascending: Smallest values first (1, 2, 3...)
- Descending: Largest values first (...100, 99, 98)
Example (Raw label sorting):
- Ascending: Alphabetical order (A, B, C...)
- Descending: Reverse alphabetical order (Z, Y, X...)
Sort Properties
Column Property
Setting: Column property
Options: Value, Horizontal Percentage, Cell Percentage, Indice
Default: Value
When using "Column Value" sort, choose which metric to sort by.
- Value: Value of cells (AND Vertical Percentage)
- Horizontal Percentage: Percentage within row
- Cell Percentage: Value divided by the cell's own base (see Cell Percentage). Unlike the vertical percentage, it can give a different order from Value when bases vary from row to row.
- Indice: Index value
For percentage tables, sorting by "Value" and "Vertical Percentage" yield exactly the same order, reason why only 'value', 'horizontal percentage' and 'Indice' options are shown.
Fixed Row/Column Positioning
Force certain rows or columns to stay at the beginning or end, regardless of sort order.
In the folowing settings, multiple labels can be specified separated by commas. The comparison is not case sensitive and enclose labels in double quotes if they contain comma.
e.g., My Brand, My First Competitor or "Not Answered","no, never"
First Rows
Setting: 'First row(s)' label(s)
Type: Text input
Format: Comma-separated
Example: My Brand, My First Competitor
These rows always appear first in your table, even if a sort would normally place them elsewhere.
Last Rows
Setting: 'Last row(s)' label(s)
Type: Text input
Format: Comma-separated
Example: Not Answered, Other
These rows always appear last in your table.
Example:
Configuration: Last rows = "Not Answered","Other"
Result table:
- Product A
- Product B
- Product C
- Not Answered (always last)
- Other (always last)
Column sorting
Setting: Column sort on labels
Type: True/False
Example: False
When enabled, columns are sorted depending on their labels alphabetically. Otherwise, columns remain in the order they come from the data source. See About sorting elements in Power BI section for more details.
Find number in Column Labels
Setting: Find number in Column Labels
Options: True, False
Default: False
When enabled, this setting extracts numeric values from column labels for sorting purposes. This is particularly useful when your column labels contain numbers mixed with text.
This feature works the same as for row labels. See Find number in Row Labels section for more details.
First Columns
Setting: 'First column(s)' label(s)
Type: Text input
Format: Comma-separated
Example: Current Year, Last Year
These columns always appear first.
Last Columns
Setting: 'Last column(s)' label(s)
Type: Text input
Format: Comma-separated
Example: Previous Year, Two Years Ago
These columns always appear last.
About sorting elements in Power BI
Power BI has its own sorting behavior that can interact with SDM Power BI Table's sorting settings. Here are some key points to understand:
- Power BI will use either a logic alphabetical order for rows and columns, either the order it find data in the data source. This depends on the data model and how fields are configured.
- There is a way to create a custom sort order in Power BI by creating a separate "sort order" column in your data model and linking it to the field you want to sort. This will naturally send the data in this order to the SDM Power BI Table visual and therefore will not require any sorting setting in the visual itself.
- Socio Data Management © propose custom service to help you create automatically such sort columns in your data model if needed from any datasource (SPSS, CSV, Excel, SQL, Triple-S XML etc...). These sort columns are automatically attached to the relevant fields in the data model so that ALL Power BI visuals (including SDM Power BI Table) will use them for sorting.
- Even if you use the sort settings in the data source, any sorting settings in the SDM Power BI Table visual will override Power BI's sorting.
- Unless you use either the sort columns trick or the SDM Power BI Table visual sorting settings, there is no guarantee about the order of rows and columns in Power BI, as it can depend on various factors like data refreshes, model changes, etc.
Best Practices
- Use Column Sort for Insights: Sort by the most important metric (sales, satisfaction, etc.)
- Use first rows/columns for Key Items: like your brand or your main topic of research
- Use last rows/columns for "Other", "Not answered", undefined or "Missing categories: Keeps focus on main data
- Totals and subTotals columns are Allways fixed before the detailed columns
- Alphabetical for Stability: Use alphabetical sort for consistent report appearance
- Limit Fixed Items: Too many fixed rows makes the table confusing
- Consider User Expectations: Sort in a logical order for your audience
Tips & Tricks
- Multiple Sort Levels: Combine with ranking to show top performers visually
- Dynamic Sorting: Power BI's interactions allow end-users to click columns to resort (with Power BI native features)
- Regional Reports: Use First/Last columns to keep comparison columns visible while scrolling
Troubleshooting
Q: Sort doesn't seem to work
A: Ensure you've selected a sort method other than "None"
Q: My first/last rows aren't appearing
A: Check the exact spelling and case of row labels
Q: Column value sort uses wrong column
A: Verify you selected the correct column in "Row Sort Column" setting
Q: I set "Column Value" sorting but nothing moves
A: The column path matched no column, so all rows share a null sort value. Check every segment of the path against the labels displayed in the table, and make sure the segments are separated by a pipe | (not by >, which is only the display format of the Regex match status field).
For more help, see the Quick Start Guide.