'Table Contents' settings Reference
Overview
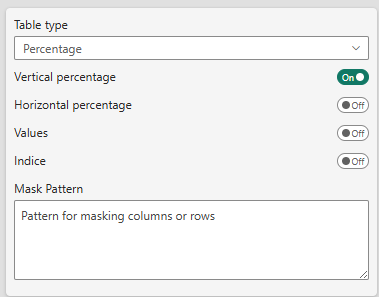
Table Type
Setting: Table type (Percentage or Mean)
Default: Percentage
Percentage Tables
Used to analyze distributions, proportions, and response rates.
Available Displays:
- Values: Raw count or sum
- Vertical Percentage (%): Percentage within each column
- Horizontal Percentage (%): Percentage within each row
- Indice: Index value (typically 100 = average)
Example: In a survey of 100 respondents:
            Very Satisfied    Satisfied    Neutral
North       45 (60%)         30 (40%)     25 (33%)
South       35 (47%)         45 (60%)     45 (60%)
Total       80 (53%)         75 (50%)     70 (47%)
Mean Tables
Used to analyze averages and their statistical properties.
Available Displays:
- Mean Values: Average of the metric
- Count: Number of observations used in calculation
- Standard Deviation: Measure of variability
- Indice: Index based on mean values
Example: Average customer satisfaction score:

Display Options
Values
Label: Show values
Type: Toggle
Default: Off
When enabled, displays the raw count or sum in each cell.
Vertical Percentage
Label: Vertical percentage
Type: Toggle
Default: On
Shows each cell's value as a percentage of its column total. Useful for comparing across categories within groups.
Horizontal Percentage
Label: Horizontal percentage
Type: Toggle
Default: Off
Shows each cell's value as a percentage of its row total. Useful for comparing category distribution within segments.
Indice
Label: Show indice
Type: Toggle
Default: Off
Displays index values (typically with 100 as base). Useful for comparing relative performance against an average.
Calculation: (Cell Value / Average) × 100
Empty Datasets
Clear on Empty dataset
Label: Clear on Empty dataset
Type: Toggle
Default: Off
Controls what the visual shows when the incoming dataset contains no rows — most commonly when a page or report filter excludes everything.
Without this option, an empty dataset would still draw an empty "shell" (a column header plus a Base row at 0), which can look like the visual is broken. This toggle lets you choose a cleaner behavior instead:
- Off (default) — the visual displays a localized "No data to display" message. The message is translated into every language the visual supports.
- On — the visual renders nothing at all, clearing any previous content. Power BI is still notified that rendering has completed, so the visual does not appear stuck in a loading state.
Regardless of the Show Excel Export Button setting, the export button is always hidden when there is no data, since there would be nothing to export.
Masking
When you filter data in Power BI, the underlying data is removed from the visual, which can affect calculations like totals and percentages. Masking allows you to hide specific data points while still including them in calculations, ensuring accurate results.
Mask Pattern
Label: Mask Pattern
Type: Text area
Default: Empty
Allows you to mask (hide) data from specific rows or columns using regular expressions.
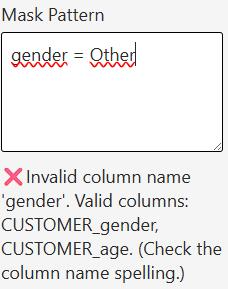
User will input a pattern to match the rows/columns to be hidden. As an example, if you want to show ONLY Brand A and Brand B, you need to hide everything which is NOT Brand A or B.
Label_Brand != BrandA AND Label_Brand != BrandB
or better with the IN operator
NOT Label_Brand IN (BrandA, BrandB)
Therefore, if also you do not want the "No answer" to gender question while still using it in calculations:
(NOT Label_Brand IN (BrandA, BrandB)) OR Customer_Gender = "Not Stated"
etc ...
(NOT Label_Brand IN (BrandA, BrandB)) OR (Customer_Gender IN ("Not Stated", Other))
The pattern defines what to HIDE, this can be somewaht counter-intuitive at first.
Valid operators are:
- IN - for multiple values
- AND - for logical conjunction
- OR - for logical disjunction
- NOT - for negation
- = - Equals
- != - Not equals
- < - Less than
- > - Greater than
- LIKE - Pattern matching with % wildcard
if you want to filter for years greater than or equal to 2020, you need to use Year > 2019
The LIKE operator works with the % symbol, for example:
Customer_Gender LIKE %ale
Will hide M'ale' AND Fem'ale', and therefore show only "Not Stated" and "Other"
To show only Male AND Female, you need to invert the logic:
NOT Customer_Gender LIKE %ale
Will show ONLY Male and Female
If a category has no value in your data (Power BI shows it as blank), it appears as an empty label in the table — not the word "Null". A pattern like Label_Brand = Null will therefore never match it.
To target blank values specifically, compare against an empty string:
Label_Brand = ""
To exclude blanks while keeping everything else, use the greater-than operator:
Label_Brand > ""
Use Cases:
- Hide sensitive data in shared reports
- Remove small brands/categories from view
- Focus on top-performing segments
- Filter out "Other" or "Not answered" categories while still taking them into account for calculations
Series Configuration
For detailed series configuration options (Value Series, Base Series, Mean Series, etc.), see:
- Percentage Series Usage — For percentage tables
- Mean Series Usage — For mean tables
Best Practices
- Choose Table Type First: Percentage vs Mean fundamentally changes how data is displayed
- Limit Display Fields: Use 2-3 display options maximum for clarity
- Use Masking Sparingly: Masked data is still calculated but hidden
- Precision for Business: Use 0-1 decimal places for most business reporting
- Totals Context: Show totals to help readers understand the base size
Related Settings
- Totals Settings — Configure total rows and columns
- Series Configuration — Detailed data mapping
- Sorting Options — Arrange rows and columns
Troubleshooting
Q: Values appear as "0%" or very small numbers
A: Check that your base series is correctly mapped in percentage series settings.
Q: Indice values don't look right
A: Ensure you've configured both values and base series correctly.
Q: Mask pattern isn't working
A: Check your regular expression syntax. Use simple patterns like Total before complex regex.
For more help, see the Quick Start Guide.