Thresholds & Masking Reference
Overview
In survey research, a figure computed on too few respondents is not reliable — and sometimes must not be shown at all (confidentiality, client rules, statistical honesty). The Threshold card automates this with two levels of protection:
- Warning — the value is displayed, but flagged with a ⚠️ symbol: "interpret with caution".
- Mask — the value is replaced by
---: "not enough respondents to show this figure".
Both levels compare a reference value (which you choose — see Threshold On) against two numeric thresholds. A value below the Mask Threshold is masked; a value below the Warning Threshold (but at or above the mask threshold) gets the warning symbol.
The Mask Pattern setting in the Table contents card hides entire columns by name using an expression. Thresholds, on the other hand, act on values — they warn or mask figures based on sample size. The two features are independent.
Settings
Location: Format pane → Threshold card
| Setting | Type | Default | Description |
|---|---|---|---|
| Use Thresholds | Toggle | Off | Master switch for the whole card. |
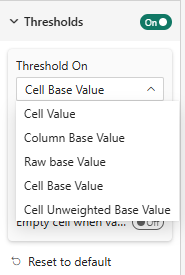
| Threshold On | Dropdown | Cell Value | The reference value tested against the thresholds (see below). |
| Warning Threshold | Integer (supports fx rules) | 50 | Below this value, a ⚠️ symbol is shown next to the figure. |
| Mask Threshold | Integer (supports fx rules) | 30 | Below this value, the figure is replaced by ---. |
| Empty cell when value is zero | Toggle | Off | Cells whose count is exactly 0 are rendered empty instead of showing 0 / 0%. |
Warning Threshold and Mask Threshold both accept Power BI conditional formatting rules (the fx button). You can therefore drive the thresholds from a measure — for example a per-wave or per-country minimum base defined in your model.
Threshold On — choosing what is tested
This dropdown decides which number is compared to the two thresholds, and therefore at which granularity the warning/masking applies.
| Option | What is tested | Granularity | Typical use |
|---|---|---|---|
| Cell Value | The value displayed in the cell (weighted count in a % table, the mean itself in a mean table) | Cell | Hide rare answer combinations in a frequency table. |
| Column Base Value | The weighted base of the whole column (the Base row) | Column | Mask every figure of a column whose base is too small. |
| Column Unweighted Base Value | The unweighted (respondent) base of the whole column (the Unweighted Base row) | Column | Same, but on real respondent counts — the usual statistical criterion. |
| Cell Base Value (new) | The weighted base used to compute the cell | Cell | Mean tables: mask a mean computed on a small weighted base. |
| Cell Unweighted Base Value (new) | The unweighted (respondent) base of the cell | Cell | The most rigorous cell-level criterion: the real number of people behind the figure. |
Cell-level vs column-level
- The two Column … options test one number per column and apply the result to every cell of that column. When masking triggers, the whole column shows
---; when only the warning triggers, the ⚠️ symbol is shown on the base row only (flagging the column without cluttering every cell). - Cell Value and the two Cell … options test each cell independently: masking and the ⚠️ symbol apply cell by cell.
Why the two new Cell Base options?
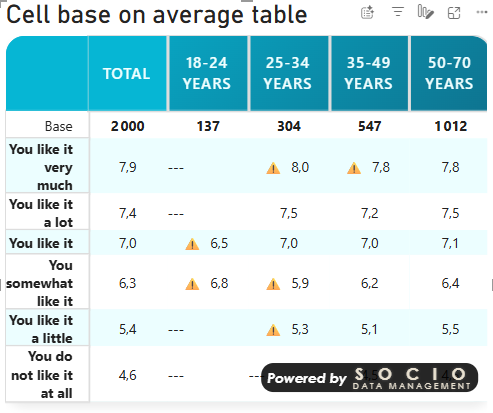
Cell Value tests the number that is displayed. That works naturally in a percentage table, where the underlying cell value is a weighted count. But in a mean table, the displayed value is the mean — so with Cell Value you would be comparing a satisfaction score of 7.2 against a base threshold of 30, which is meaningless.
The two new options fix this by testing the cell's calculation base instead of its displayed value:
- Cell Base Value → the weighted base that weights the mean (or backs the percentage);
- Cell Unweighted Base Value → the raw number of respondents behind the cell.
They are also more precise in percentage tables: the weighted count of a cell is not its base (and even less its respondent count). If your masking rule is "no figure under 30 respondents", Cell Unweighted Base Value is the option that says exactly that.
| Table type | Rule you want | Threshold On |
|---|---|---|
| Percentages | "Don't show columns under N respondents" | Column Unweighted Base Value |
| Percentages | "Don't show any figure under N respondents" | Cell Unweighted Base Value |
| Means | "Don't show means computed on fewer than N respondents" | Cell Unweighted Base Value |
| Means (weighted rule) | "Don't show means whose weight is under N" | Cell Base Value |
The base options read the Base / Unweighted base series of your table (see Understanding Bases). If the corresponding series is not mapped in Percentage Series or Mean Series, the tested value is 0 and everything gets masked. If you suddenly see a table full of ---, check the series mapping first.
Behavior in detail
Warning (⚠️)
When the tested value is below the Warning Threshold but at or above the Mask Threshold:
- Cell-level modes — a ⚠️ symbol is prepended to the cell content.
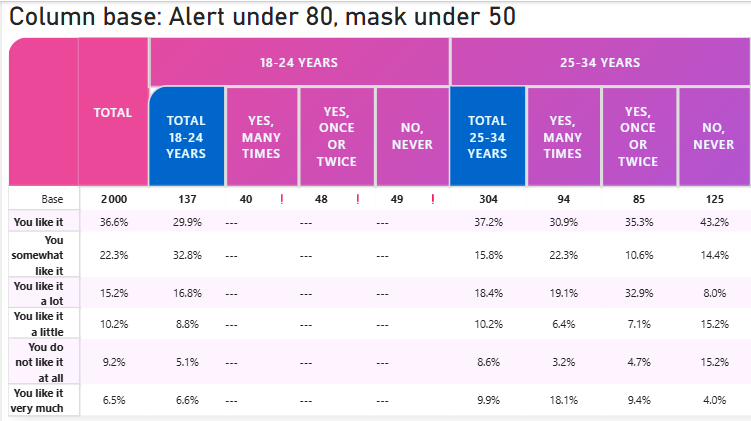
- Column-level modes — the ⚠️ symbol is shown on the Base row (or Unweighted Base row) of the affected column; data cells stay clean.
Mask (---)
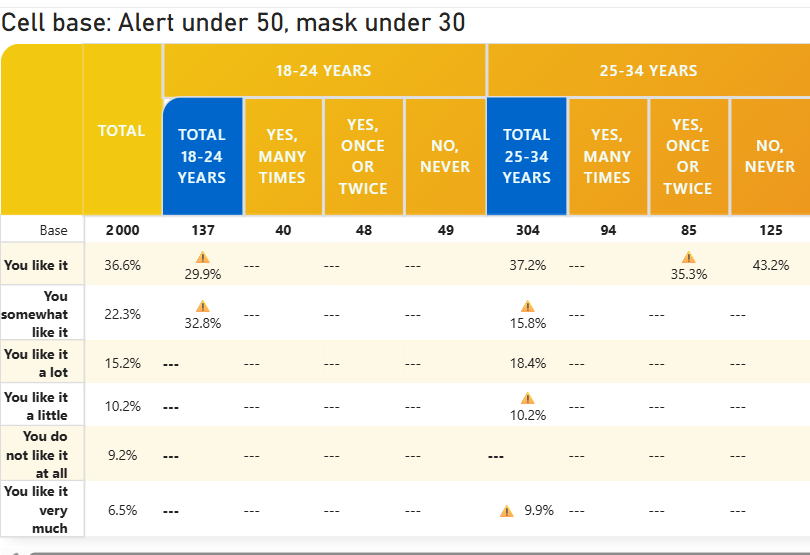
When the tested value is below the Mask Threshold:
- Data cells display
---instead of their content (in tile display mode, an empty tile is shown instead). - Base rows are never masked. In column-level modes, the base row keeps its value and displays a red ❗ symbol — so you can always see why the column is masked.
Empty cell when value is zero
With this toggle on, a cell whose count is exactly 0 is rendered completely empty (no 0, no 0.0%). This is a readability option, useful on sparse tables — an empty cell reads as "nobody", while --- reads as "hidden". It takes precedence over masking: a zero cell is shown empty, not as ---.
Note that this option is part of the Threshold card and only active while Use Thresholds is on.
Interactions with other features
- Cell Rules cannot un-mask a cell: a threshold-masked cell keeps its
---, although a rule can still decorate it (background, badge). If you need finer conditional logic than thresholds provide (e.g. color instead of masking, compound conditions onbase/uBase), Cell Rules can express it — the rule context exposes the weightedbaseof the cell among its variables. - Totals & base rows — thresholds act on data cells; total rows are only affected by the column-level modes as described above (warning/alert symbols on the base rows, never masking).
- Excel export exports what is displayed: masked cells are exported as masked.
Troubleshooting
- Everything is masked (
---everywhere) → the tested series is missing or zero. Check that the Base / Unweighted base series required by yourThreshold Onchoice is mapped (Percentage Series, Mean Series). - Means are masked/warned erratically → you are probably on
Cell Value, which tests the mean itself in a mean table. Switch to Cell Unweighted Base Value (or Cell Base Value). - A whole column is masked but its base looks fine → you are on a Column … mode and looking at the other base row (weighted vs unweighted). The base row of the tested mode carries the red ❗.
- I want to hide specific columns, not small ones → that is Mask Pattern, not thresholds.
See Understanding Bases for how bases are computed and aggregated, or the Quick Start Guide to start building tables.